Heatmap and click tracking are essential tools at Labridge Digital Marketing. We use them in our CRO services in the Philippines to help businesses understand where visitors look and click on their websites. That is to say, this knowledge allows companies to make smart changes to their site design and content, boosting user engagement.
Heatmaps show where activity on your website is highest. They help you see which parts of your page get the most attention. For instance, if you notice that visitors often stop scrolling halfway down a page, it’s a good idea to place important information above that point to make sure it gets seen.
Click tracking records where users click on your site. This information tells you what interests your visitors and what does not. Knowing this helps you focus on the areas that matter most to your audience.
So, why use these tools? They make it easier to improve your website based on real user behavior. When you adjust your site to better meet user needs, you not only make their experience better but also increase the chances they will interact more with your site, leading to more conversions and satisfied customers.
What is Heatmap and Click Tracking

Heatmap and click tracking are essential tools for understanding user behavior on websites. In other words, they help you see where visitors focus and click. This section will define these tools, explain their importance, and provide a brief overview of how they work.
Defining Heatmap and Click Tracking
Heatmap and Click Tracking
Are visual tools that show how users interact with a web page.
Heatmaps
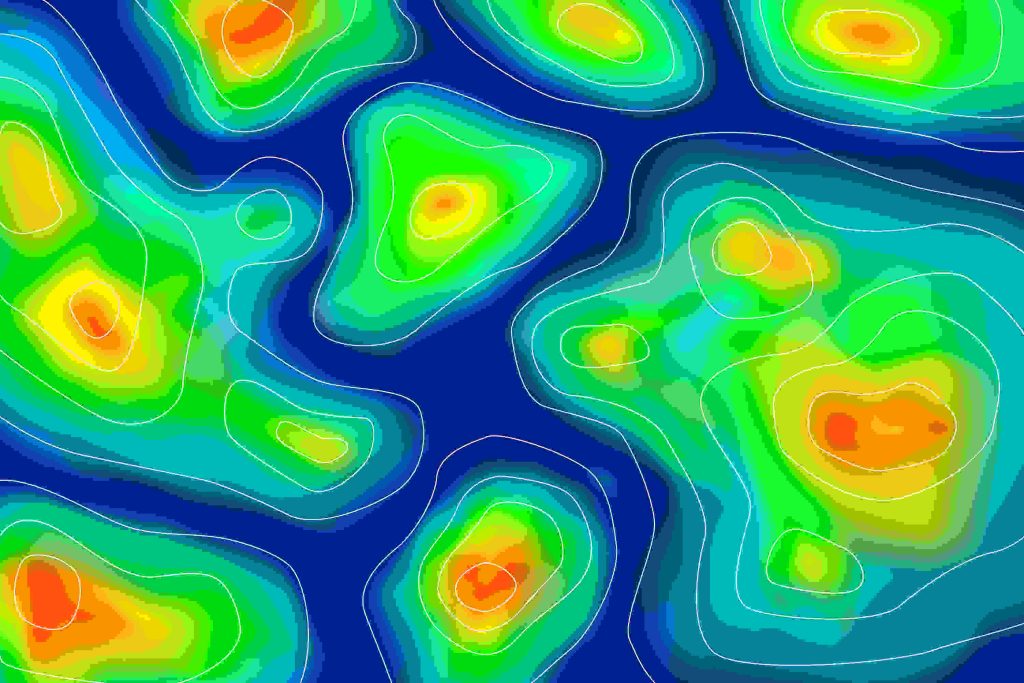
Display data using colors to represent the areas where users are most active. For instance, red areas indicate high activity, while blue areas show less activity.
Click Tracking
Records where users click on a webpage. For instance, it shows which links, buttons, or images get the most attention.

Importance in Understanding User Behavior
Understanding user behavior is crucial for website optimization. Therefore, heatmap and click tracking provide insights into what users do on your site. So, this is important because:
- Reveals which parts of your site attract the most attention.
- Helps identify areas that might be confusing or uninteresting.
- Allows you to make data-driven decisions to improve user experience.
For instance, if a heatmap shows that users are not scrolling past a certain point, you might move important content higher on the page. Therefore, these tools help you make changes that enhance engagement and satisfaction.
How Heatmap and Click Tracking Work
Heatmap and Click Tracking
Tools work by collecting data from user interactions. So, here’s a brief overview:
- Data Collection: When a user visits a site, their interactions are recorded. For example, this includes clicks, scrolls, and movements.
- Data Visualization: The recorded data is then transformed into visual maps. Heatmaps use colors to show activity levels. Also, click tracking shows exact click locations.
- Analysis: You can analyze these visual maps to understand user behavior. For instance, if most users click on a specific image, you might highlight it more.
These tools are easy to implement. Most require adding a small code snippet to your website. After that, you can start collecting data and visualizing it through the tool’s dashboard.
In summary, heatmap and click tracking are powerful tools for understanding how users interact with your website. They provide clear insights into user behavior, helping you make informed decisions to improve your site. Therefore, by using these tools, you can enhance user experience and achieve better engagement and conversion rates.
Benefits of Using Heatmap and Click Tracking
Heatmap and click tracking tools offer many benefits. They help you understand how visitors use your website. So, this section will explain these benefits, such as improving user experience, increasing conversion rates, making data-driven decisions, and finding problem areas on your site.
Improved User Experience
Heatmap and click tracking tools can greatly enhance user experience (UX) assessment.
- Identify Popular Areas: Heatmaps show which parts of your site get the most attention. For example, if users click on a certain image a lot, you can make it more noticeable.
- Optimize Navigation: Click tracking reveals how users move around your site. If users have trouble finding certain links, you can rearrange them to be more accessible.
That is to say, these insights help you design a site that is easier and more enjoyable for users.
Enhanced Conversion Rates
Heatmap and click tracking can help boost your conversion rates.
- Highlight Key Areas: By knowing which areas are popular, you can place important calls-to-action (CTAs) there.
- Reduce Drop-Off Points: If users leave at a certain point on your site, you can improve that section to keep them engaged.
In other words, understanding user behavior can lead to more conversions.
Data-Driven Decision-Making
Heatmap and click tracking support making decisions based on data.
- Objective Insights: These tools provide clear data on how users behave. That is to say, this helps you make smart decisions rather than guessing.
- Track Changes: By regularly checking heatmaps and click data, you can see how changes to your site impact user behavior.
Therefore, you can adjust your site based on real data, leading to better results.
Identifying Problem Areas on Your Site
Heatmap and click tracking help you find and fix problem areas on your site.
- Unused Sections: Heatmaps show which parts of your site users ignore. If some sections get little attention, you might need to change or remove them.
- Improve User Flow: Click tracking shows how users move through your site. If users often get stuck in one area, you can make it easier to navigate.
Above all, fixing these issues makes your site more user-friendly.
In summary, heatmap and click tracking have many benefits. They improve user experience, boost conversion rates, help you make data-driven decisions, and identify problem areas. Using these tools can make your website better, leading to happier users and better business results. Additionally, incorporating mobile conversion optimization can further enhance these benefits by ensuring your site performs well across all devices.
Types of Heatmaps
Heatmap and click tracking tools come in different types. That is to say, each type helps you understand user behavior in a unique way. This section will explain the main types: click heatmaps, scroll heatmaps, and move heatmaps. We will also explore the use cases for each type.
Click Heatmaps
Click heat maps show where users click on your website.
- Definition: They use colors to highlight areas with the most clicks.
- Use Case: Click heatmaps are useful for understanding which links, buttons, or images attract the most attention. For example, if a button gets a lot of clicks, it might be in a good position.
In other words, click heatmaps help you see what interests your users the most.
Scroll Heatmaps
Scroll heatmaps reveal the depth to which users scroll down a page.
- Definition: They use colors to indicate how many users reach different parts of the page.
- Use Case: Scroll heatmaps are useful for seeing how much content users view. For instance, if most users only scroll halfway down a page, you might want to move important content higher up.
That is to say, scroll heatmaps help you place key information where users will see it.
Move Heatmaps
Move heat maps track where users move their mouse on the screen.
- Definition: They use colors to show areas where the mouse spends the most time.
- Use Case: Move heat maps are useful for understanding which parts of a page attract visual attention. For example, if users move their mouse over certain text or images, these areas might be of interest.
In addition, move heatmaps can help you see if users are hesitating or struggling with certain parts of your site.
In summary, there are three main types of heatmaps: click heatmaps, scroll heatmaps, and move heatmaps. Each type offers distinct insights into user behavior. By using these heatmaps, you can better understand what your users do on your site. This helps you make smart changes to improve user experience and achieve your goals. Heatmap and click tracking are powerful tools for making your website more effective.
Implementing Heatmap and Click Tracking Tools

Implementing heatmap and click tracking tools can enhance your website’s performance. This section will provide an overview of popular tools like Hotjar and Crazy Egg. It will also give a step-by-step guide on setting up these tools and offer tips for effective implementation. So , using heatmap and click tracking can help you understand user behavior and improve your site.
Overview of Popular Tools
There are many tools available for heatmap and click tracking.
- Hotjar: Hotjar is a popular tool for heatmap and click tracking. It offers insights into user interaction with your site. Also, Hotjar offers features like click heatmaps, scroll heatmaps, and move heatmaps.
- Crazy Egg: Crazy Egg is another well-known tool. It offers similar features to Hotjar and includes additional options like A/B testing and session recordings.
In other words, both Hotjar and Crazy Egg are excellent choices for understanding user behavior on your website.
Step-by-Step Guide on Setting Up These Tools
Setting up heatmap and click tracking tools is straightforward. Here is a simple guide:
- Sign Up: First, sign up for an account with your chosen tool, such as Hotjar or Crazy Egg.
- Install Tracking Code: After signing up, you will receive a tracking code. Insert this code into your website’s HTML. This step is essential for data collection.
- Create a Heatmap: Once the code is installed, create a new heatmap in the tool’s dashboard. Select the page or pages you want to track.
- Set Up Click Tracking: Enable click tracking to start collecting data on user clicks. This will show you where users are clicking on your site.
- Review Data: After setting up, give it some time to collect data. Then, review the heatmaps and click data to see user behavior.
That is to say, setting up these tools involves simple steps that provide valuable insights.
Tips for Effective Implementation
To get the most out of heatmap and click tracking tools, follow these tips:
- Start with Key Pages: Focus on your most important pages first. These might be your homepage, product pages, or checkout pages.
- Regularly Check Data: Review the data regularly to understand how users interact with your site. Observe patterns and changes over time.
- Make Data-Driven Changes: Use the insights from heatmaps and click tracking to make informed changes to your site. For example, if a button isn’t getting clicks, try changing its position or color.
- Combine with Other Data: Use heatmap and click tracking data along with other analytics tools. This gives a more complete picture of user behavior.
In addition, always test changes to see how they impact user experience and site performance.
In summary, implementing heatmap and click tracking tools like Hotjar and Crazy Egg can provide valuable insights into user behavior. By following a simple setup process and using the data effectively, you can improve your website’s performance. Regularly reviewing the data and making informed changes can lead to a better user experience and higher conversion rates. Heatmap and click tracking are essential tools for any website looking to succeed online.
Analyzing Heatmap Data
Analyzing heatmap data helps you understand how users interact with your website. Therefore, this section will explain how to analyze data from heatmap and click tracking tools. By doing this, you can make informed decisions to improve your site. We will break down the process into easy steps and offer helpful tips.
Understanding Heatmap and Click Tracking Data
Heatmap and click tracking data show you where users click, how far they scroll, and where their mouse moves. That is to say, this data gives a visual map of user activity, helping you spot patterns and find issues.
Steps for Analyzing Heatmap Data
To analyze heatmap data, follow these steps:
1. Review Click Heatmaps
Start by looking at click heatmaps. Find areas with high and low click activity.
- High Click Areas: Understand why these areas get clicks. Are they buttons, links, or images? So, knowing this can help you create similar success in other parts of your site.
- Low Click Areas: Check why these areas are not getting clicks. Are they hard to see or in poor locations?
Examine Scroll Heatmaps
Look at scroll heatmaps next. See how far users scroll on your pages.
- Above the Fold: Content above the fold should catch user interest. Therefore, if users are not scrolling, important information might need to be moved higher.
- Below the Fold: Make sure the content below the fold is engaging enough to make users scroll down.
Analyze Move Heatmaps
Move heatmaps display where users position their mouse.
- Mouse Patterns: Look for spots where the mouse stays longer. These areas might attract visual attention even if they don’t get clicks.
- Navigation Issues: Find any hesitation or confusion in mouse movements. This can show navigation problems.
Tips for Effective Analysis
So, here are some tips to help you analyze your data better:
- Look for Patterns: Find consistent patterns in user behavior. For example, if users often click a specific button, it may be well-placed and attractive.
- Compare with Other Data: Use other analytics tools along with heatmap data. Therefore, this gives a complete view of user behavior.
- Focus on Key Metrics: Pay attention to metrics like click-through rates and scroll depth. So, these show how well your content engages users.
- Test Changes: Based on your analysis, make changes to your site and test the results. For instance, if users are not scrolling, try moving important content higher.
That is to say, effective analysis means looking for patterns, using extra data, focusing on important metrics, and testing changes.
In short, analyzing heatmap and click tracking data is key to understanding user behavior. So, by looking at click, scroll, and move heatmaps, you can see user preferences and problem areas. Also, following simple steps and tips helps you make informed decisions. This leads to a better user experience and a more effective website. Heatmap and click tracking are powerful tools for improving your site. Additionally, integrating conversion funnel analysis can further enhance your understanding of user behavior and optimize your site’s performance.
Using Click Tracking to Improve User Experience

Click tracking can make your website better for users. Therefore, this section will explain how to understand click patterns, find areas of high and low engagement, and improve user interaction using click data. So, by analyzing heatmap and click tracking data, you can make your site easier to use.
Understanding Click Patterns
Click patterns show where users click most on your site.
- Popular Elements: Click patterns reveal which buttons, links, and images get the most clicks. So, this helps you see what users like.
- Unused Elements: They also show which elements users ignore. In other words, this can highlight parts of your site that need changes.
That is to say, understanding click patterns helps you see what works well and what doesn’t.
Identifying High and Low Engagement Areas
Click tracking helps you find areas with lots of clicks and areas with few clicks.
- High Engagement Areas: These are spots where users click a lot. To clarify, high engagement areas show what interests users. For example, a button that gets many clicks is likely useful and well-placed.
- Low Engagement Areas: These are spots with few clicks. That is to say, low engagement areas suggest that users don’t notice these elements or don’t find them interesting.
Therefore, finding these areas helps you know where to make improvements.
Strategies to Enhance User Interaction Based on Click Data
Using click tracking data, you can improve user interaction.
- Enhance High Engagement Areas: Make popular elements more noticeable. For instance, if a link gets many clicks, consider making it a main part of your navigation.
- Improve Low Engagement Areas: Change low-engagement elements to make them more attractive. For instance, this could involve changing their position, size, or color to draw more attention.
- Test Different Variations: Try different versions of elements to see which works best. For example, A/B testing different button styles can help you find the most effective one.
In other words, using click data to guide your changes can make your site more user-friendly.
In conclusion, using click tracking to analyze user behavior can improve your website’s user experience. By understanding click patterns, finding high and low engagement areas, and using strategies based on this data, you can make your site more engaging and effective. Heatmap and click tracking are key tools for creating a user-friendly website.
Common Challenges and Solutions

Using heatmap and click tracking tools can come with challenges. This section will talk about common issues like data privacy concerns, handling large amounts of data, and fixing problems with data interpretation. We will also offer solutions and best practices to overcome these challenges.
Data Privacy Concerns
One big challenge is data privacy.
- User Consent: Always get user consent before tracking their data. That is to say, users need to know their activity is being monitored.
- Anonymize Data: Make sure to anonymize the data to protect user identities. This way, you can get useful insights without risking privacy.
- Compliance: Follow data protection laws like GDPR. In other words, make sure your tracking practices follow legal guidelines.
By taking care of data privacy concerns, you can use heatmap and click tracking tools safely.
Handling Large Amounts of Data
Another difficulty is handling extensive volumes of data.
- Organize Data: Use tools that help you sort and filter data. For instance, group data by page or user action to make it easier to study.
- Focus on Key Metrics: Pay attention to the key metrics that matter most to your goals. This will simplify your analysis and make it more useful.
- Automate Analysis: Use automated tools to help analyze large data sets. These tools can point out important trends and save you time.
Therefore, handling data well ensures you get valuable insights without feeling overwhelmed.
Addressing Discrepancies in Data Interpretation
Problems in data interpretation can cause confusion.
- Consistent Metrics: Use the same metrics across your analysis. This helps avoid mistakes and keeps your data reliable.
- Multiple Tools: Compare data from different tools to ensure accuracy. For example, use both heatmap and click tracking data to get a complete view.
- Regular Reviews: Regularly review your data and interpretations with your team. This helps catch any mistakes early and ensures everyone agrees.
In other words, clear and consistent data interpretation is key to making smart decisions.
Solutions and Best Practices
Here are some best practices to solve these challenges:
- Transparency: Be open with users about your tracking practices. This builds trust and ensures you follow data privacy laws.
- Efficient Tools: Choose tools that help you manage and analyze data well. Look for features like data sorting and automated reports.
- Training: Train your team on how to read and use the data. This ensures everyone can help make smart decisions.
- Regular Updates: Keep your tools and practices updated. Technology and laws change, so staying current is important.
Above all, following these solutions and best practices helps you get the most out of heatmap and click tracking tools.
In conclusion, while using heatmap and click tracking tools can present challenges, these can be overcome with the right approaches. Addressing data privacy concerns, managing large amounts of data, and ensuring accurate data interpretation are key. By following best practices, you can effectively use these tools to improve your website and provide a better user experience. Heatmap and click tracking are powerful tools when used correctly.
Best Practices for Heatmap and Click Tracking

To make the most of heatmap and click tracking, follow best practices. This section will explain how to regularly monitor and analyze data, combine heatmap data with other tools, adjust your website design based on insights, and continuously optimize your site.
Regular Monitoring and Analysis
Keep an eye on your heatmap and click tracking data.
- Stay Updated: Check your data often. That is to say, look at it regularly to spot trends and changes.
- Identify Patterns: Regular reviews help you see patterns in user behavior. For instance, if a button gets clicked a lot, it is likely important to users.
In other words, regular monitoring helps you understand what users do on your site.
Combining Heatmap Data with Other Analytics Tools
Use other tools along with heatmap and click tracking.
- Use Multiple Sources: Combine heatmap data with tools like Google Analytics. So, this gives you a complete picture of user behavior.
- Cross-Verify Data: Check what your heatmap data shows with other tools. For example, if a heatmap shows low clicks in one area, see what Google Analytics says about it.
Therefore, using multiple tools helps you get accurate insights.
Adjusting Your Website Design Based on Insights
Improve your website design using heatmap and click tracking data.
- Highlight Key Areas: Make important areas more visible. For example, if users click a button a lot, move it to a more prominent spot.
- Fix Low-Engagement Areas: Change areas that get a few clicks to make them more interesting. This could mean redesigning these parts or adding better content through effective website copywriting.
In other words, use your data to guide design changes that improve user experience.
Continuous Optimization
Keep optimizing your website to stay user-friendly.
- Test Changes: Regularly test new design changes based on your data. For example, try A/B testing to see which design works best.
- Update Regularly: Keep updating your site based on the latest data. After that, check how these changes affect user behavior and keep optimizing. Continuous landing page optimization is essential for maintaining effectiveness.
Above all, continuous optimization ensures your site stays effective and engaging.
In conclusion, following best practices for heatmap and click tracking can greatly improve your website. Regular monitoring and analysis, combining data with other tools, adjusting your design based on insights, and continuous optimization are key steps. By doing these, you make sure your site meets user needs and stays effective. Heatmap and click tracking are powerful tools when used properly.
Conclusion
In conclusion, heatmap and click tracking are essential tools for understanding user behavior on your website. By regularly monitoring and analyzing data, combining heatmap data with other analytics tools, and adjusting your website design based on insights, you can significantly improve user experience. Continuous optimization ensures your site remains effective and engaging.
Labridge Digital Marketing uses heatmap and click tracking to help businesses make data-driven decisions. That is to say, these tools reveal important patterns in user behavior, helping you to create a more user-friendly site.
In other words, heatmap and click tracking provide clear insights that guide improvements. These practices not only enhance user satisfaction but also boost conversion rates. Therefore, incorporating these tools into your strategy is crucial for success. Above all, heatmap and click tracking are powerful assets for any website looking to improve and grow.
FAQs
What is heatmap and click tracking?
Heatmap and click tracking are tools that show where users click and move on your website. They help you understand user behavior.
Why are heatmap and click tracking important?
They help you see what users like and don’t like on your site. This helps you make your site better and more user-friendly.
How do I set up heatmap and click tracking?
Sign up for a tool like Hotjar or Crazy Egg, add the tracking code to your site, and start collecting data.
What are the benefits of using heatmap and click tracking?
These tools improve user experience, increase conversion rates, and help you make data-driven decisions.
How often should I check my heatmap and click tracking data?
Regularly check your data, at least once a week, to stay updated on user behavior and trends.
What should I do if an area has low clicks?
Try changing its design or position to make it more engaging and easier for users to find.
Can heatmap and click tracking improve my website design?
Yes, by showing you which parts of your site work well and which need improvement.
Is user data collected through heatmap and click tracking safe?
Yes, if you anonymize data and follow data privacy laws like GDPR.
How can I use heatmap data with other analytics tools?
Combine heatmap data with tools like Google Analytics to get a full picture of user behavior.
What is continuous optimization?
It means regularly updating and improving your site based on the latest data to keep it effective and user-friendly.